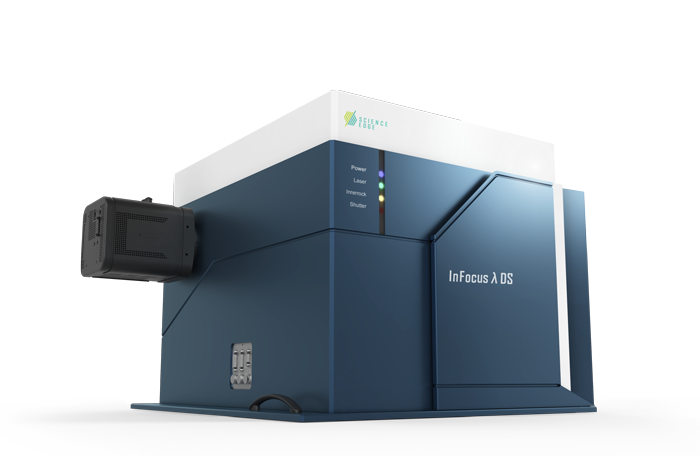
InFocus λ - Brand-new microspectroscopy
Dark-field spectroscopic imaging microscope
A dark-field microscope for observing nanoparticles, plus a fast, high-definition dark-field spectroscopic imaging. Plasmon-enhanced scattered light and fluorescence can be analysed with high spectral resolution.
HIGHLIGHT

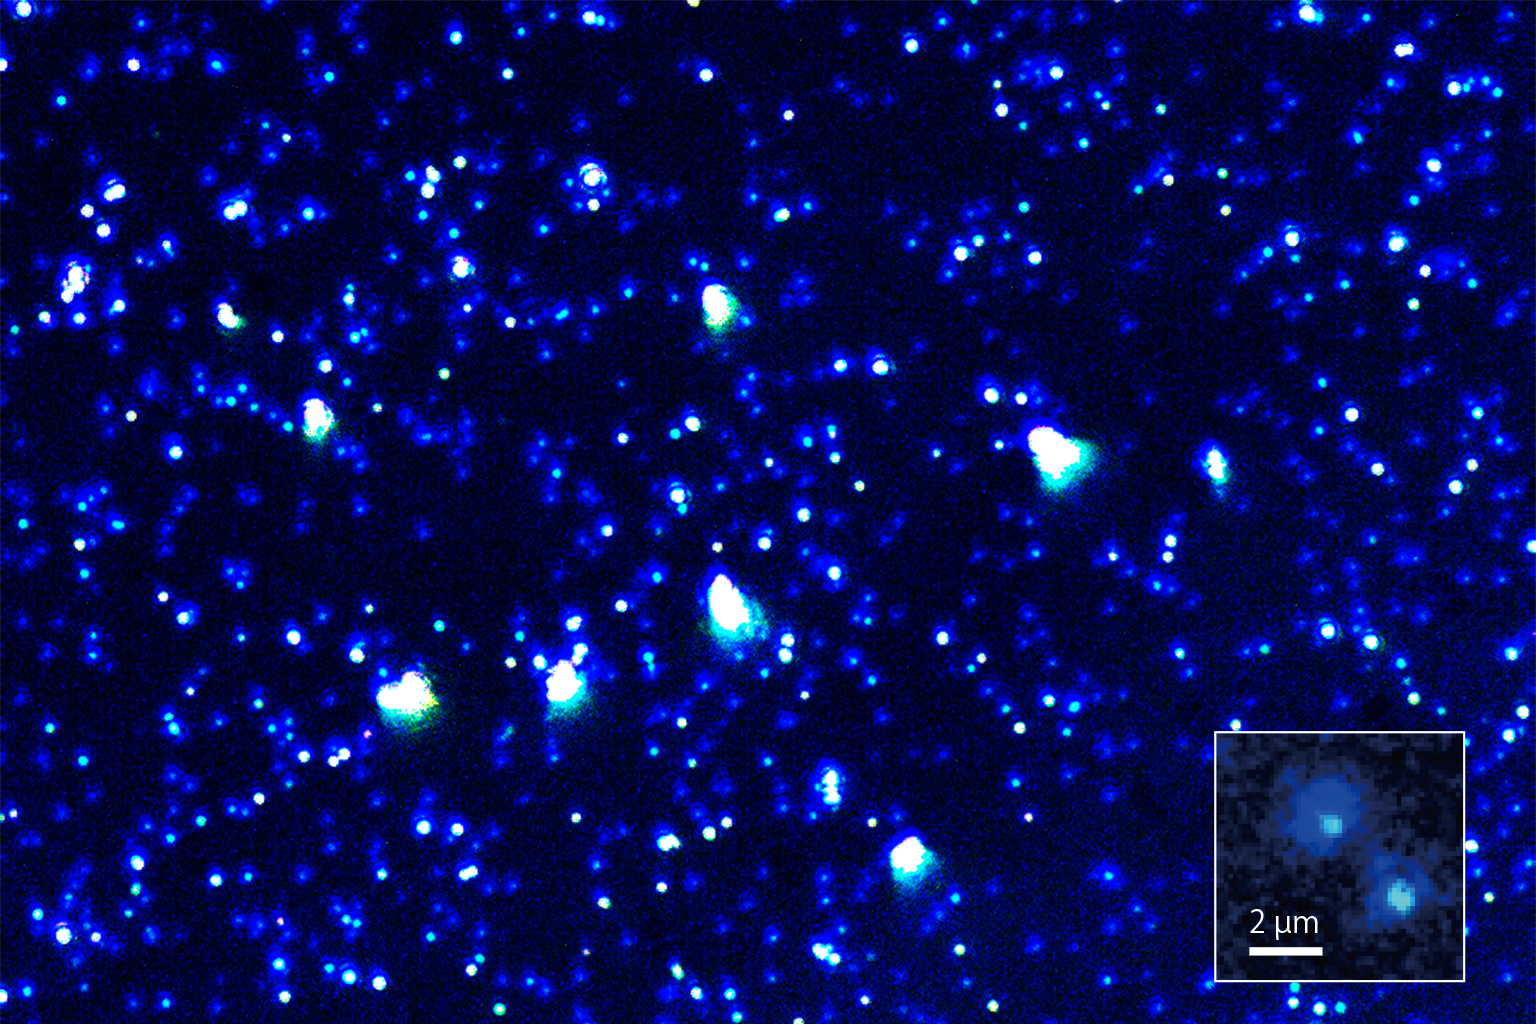
The distribution of the nanoparticles can be clearly observed under a epi-illumination dark-field microscope
Ultra-fast, high definition dark-field spectral imaging with line detection optics and high pixel CCD.
Dispersed nanoparticles can be detected, counted and listed together with spectral information.

- Overview
- Applications
- User interviews
- Papers
Overview
The InFocus λ DS dark-field spectroscopic imaging microscope is a groundbreaking instrument that merges the dark-field microscopy and hyperspectral imaging capabilities. It allows for the observation of metal nanoparticles distribution and spectral analysis of their scattering and fluorescence, proving invaluable in research and development in fields like plasmonic biosensor exploration.
Illustrated in Figure 1 is the optical system of the dark-field microscopy. Utilizing a ring diaphragm and ring mirror, it diagonally illuminates a sample with ring-shaped white LED light. It eliminates background light from the observation and enables to observe nanoparticles and nanostructures on a flat substrate.
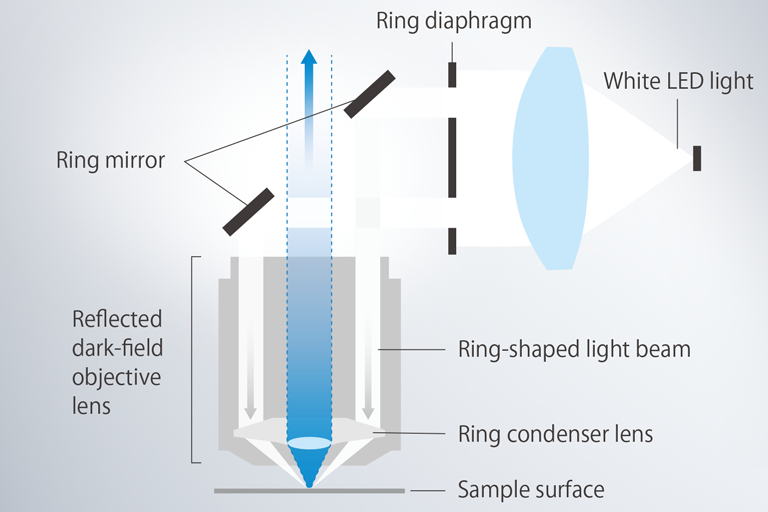
Figure. 1: Epi-illumination dark-field microscopy
Ultra-fast dark-field spectroscopic imaging with line detection
The main feature of the InFocus λ DS is its ability to perform ultra-fast and high definition dark-field spectroscopic imaging. For example, while observing the distribution of metal nanoparticles with a dark-field microscope, it is possible to select areas of interest and perform spectroscopic imaging to evaluate optical responses such as surface plasmon-enhanced scattered light and surface plasmon-excitation enhanced fluorescence as a spectrum.
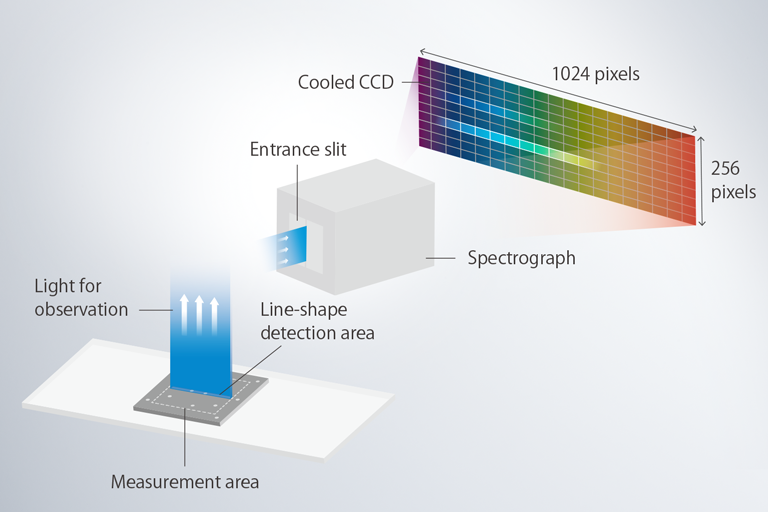
The mechanism of dark-field spectral imaging by line detection is shown in Figure 2. The slit direction of the spectrograph is used as spatial information to perform a single X-axis spectral measurement of the specified measurement area (line detection). The electrically cooled CCD with 256 x 1024 pixels allows a large amount of data to be acquired both in the spatial and spectral direction.
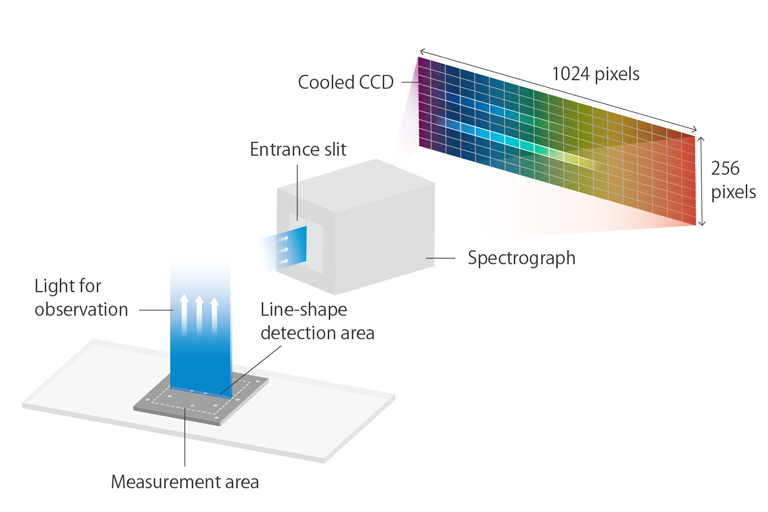
Figure. 2: Line detection mechanism. 256 points on the X-axis within the measuring area are measured spectroscopically at once.
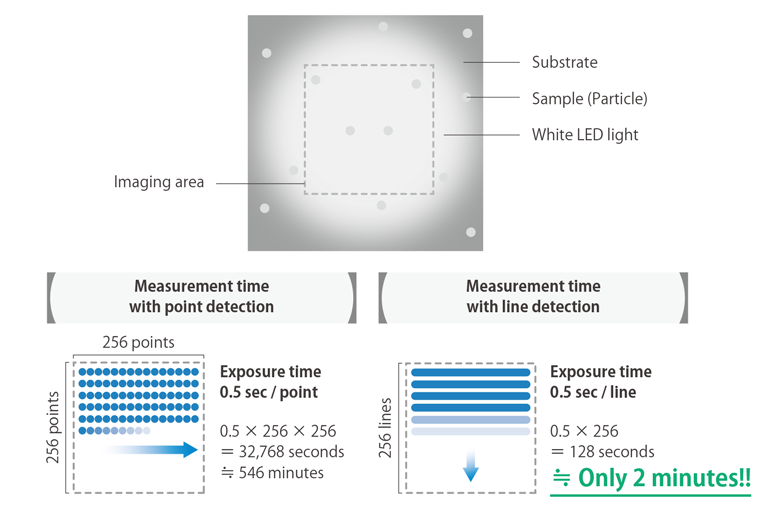
Figure 3: Comparison of measurement times for point detection and line detection.
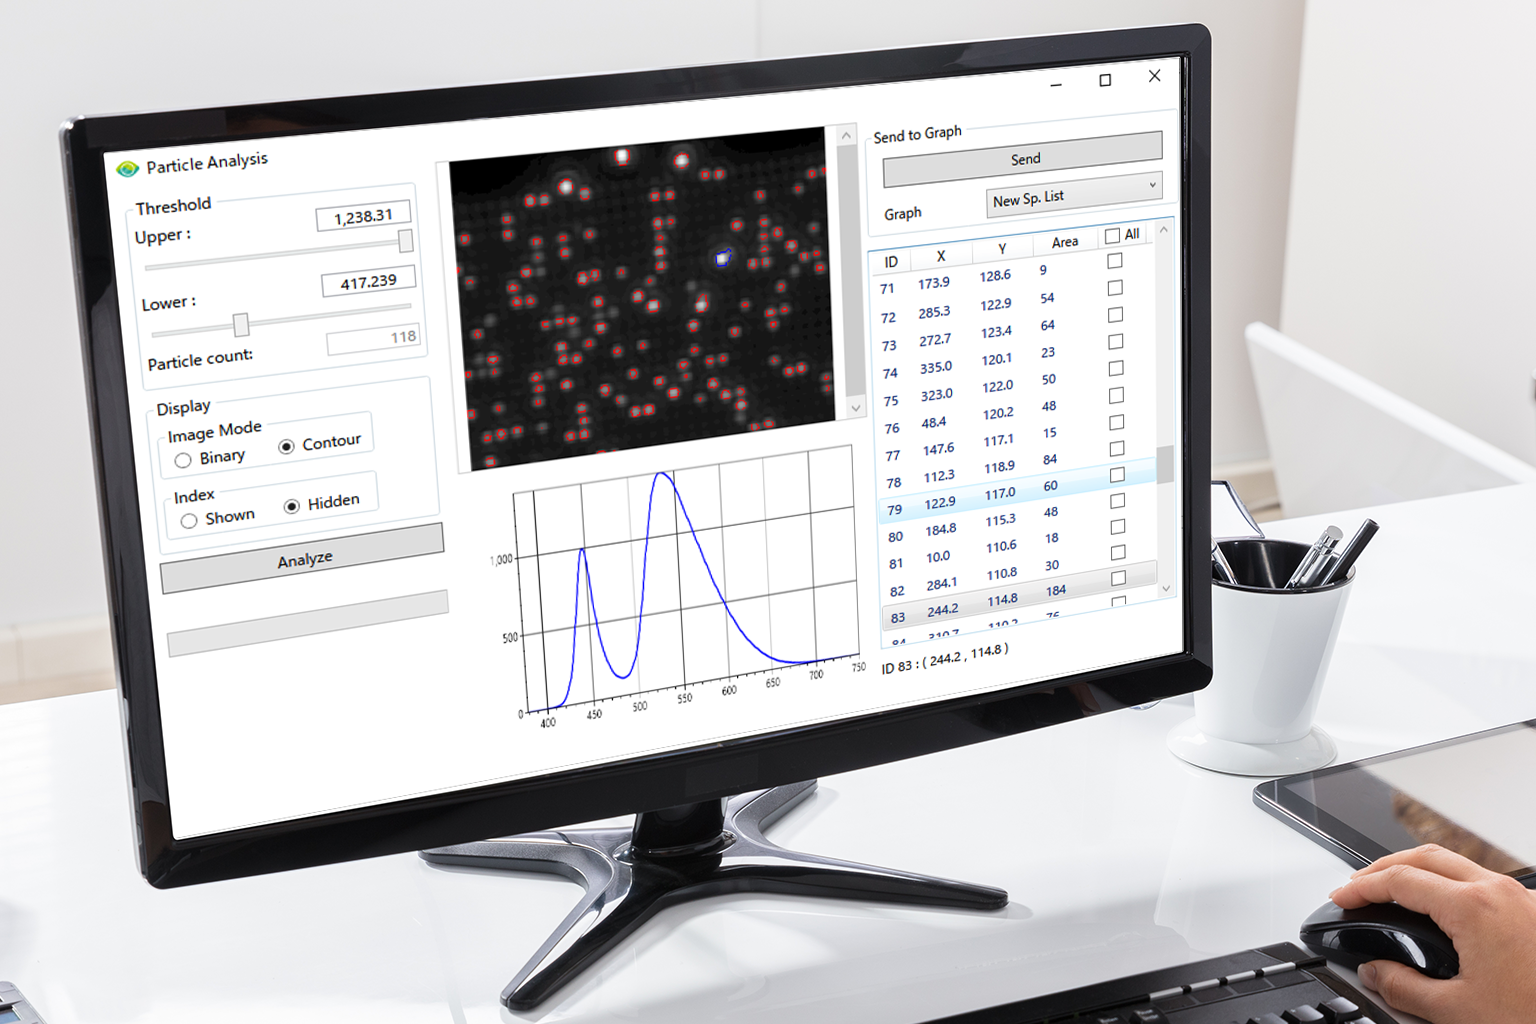
Intuitive software and particle analysis functions
Click on an area of interest in a dark-field microscope image to view the spectral information at that location. Four ROI (Region of Interest) selection modes - point, line, square and ellipse - can be selected to display the spectrum without including extra regions and avoiding noise components as much as possible.
You can also assign a pseudo-colour to any band in the spectrum and visualise its intensity distribution. In addition to displaying the average intensity distribution of selected bands, various other modes are available, such as displaying peak area intensity using the Cobell method.
Data analysis of dark-field spectral images.
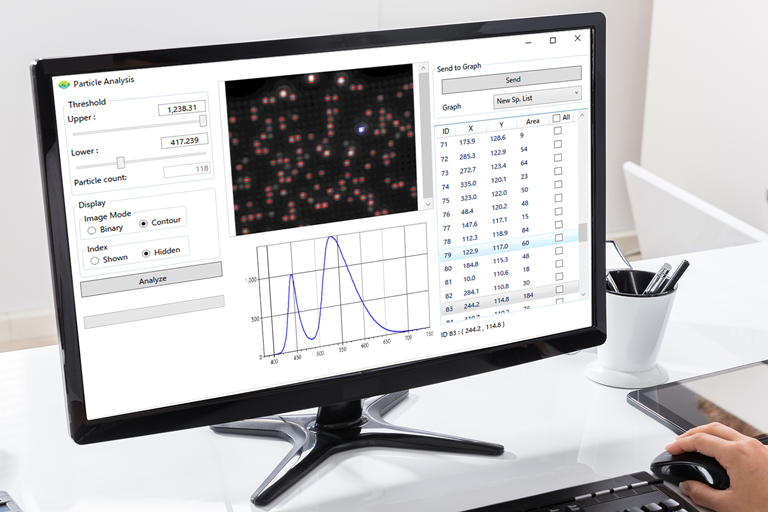
It also has a 'particle analysis function' that detects nanoparticles by applying a threshold, counts and numbers the number of particles, and automatically extracts the average spectral data for each particle and displays these information in a list.
In addition, the system is flexible enough to develop other specialised functions to suit the user's data analysis objectives.
Particle analysis function
Applications
Dark-field spectroscopy of plasmon-enhanced scattering and fluorescence from polymer-coated silver nanoparticles
In the R&D of plasmon biosensors utilizing metal nanoparticles, dark-field microscopy for nanostructure observation and spectroscopy for optical response investigation are indispensable. Here, we present an example of dark-field spectroscopic analysis focusing on surface plasmon-enhanced scattering and fluorescence from Ag nanoparticles, utilizing a dark-field spectroscopic imaging microscope.
User Interview
Professor Taka-aki Yano, Institute of Post-LED Photonics, Tokushima University (Developed and delivered in 2022)
A dark-field microscope was developed using microscopes and other equipment owned by Dr Yano's laboratory.
(Written in Japanese)
Papers
“Highly Stable Polymer Coating on Silver Nanoparticles for Efficient Plasmonic Enhancement of Fluorescence”
Ryo Kato, Mitsuhiro Uesugi, Yoshie Komatsu, Fusatoshi Okamoto, Takuo Tanaka, Fumihisa Kitawaki, and Taka-aki Yano
ACS Omega 2022, 7, 5, 4286-4292
