Hyperspectral image analysis software
Dedicated functions for hyperspectral image analysis are
incorporated in an intuitive graphical user interface.
Data analysis of vibrational spectroscopy or hyperspectral camera has never been
faster or more comfortable.
HIGHLIGHT

Intuitive GUI design that anyone can
operate without referring to a manual.
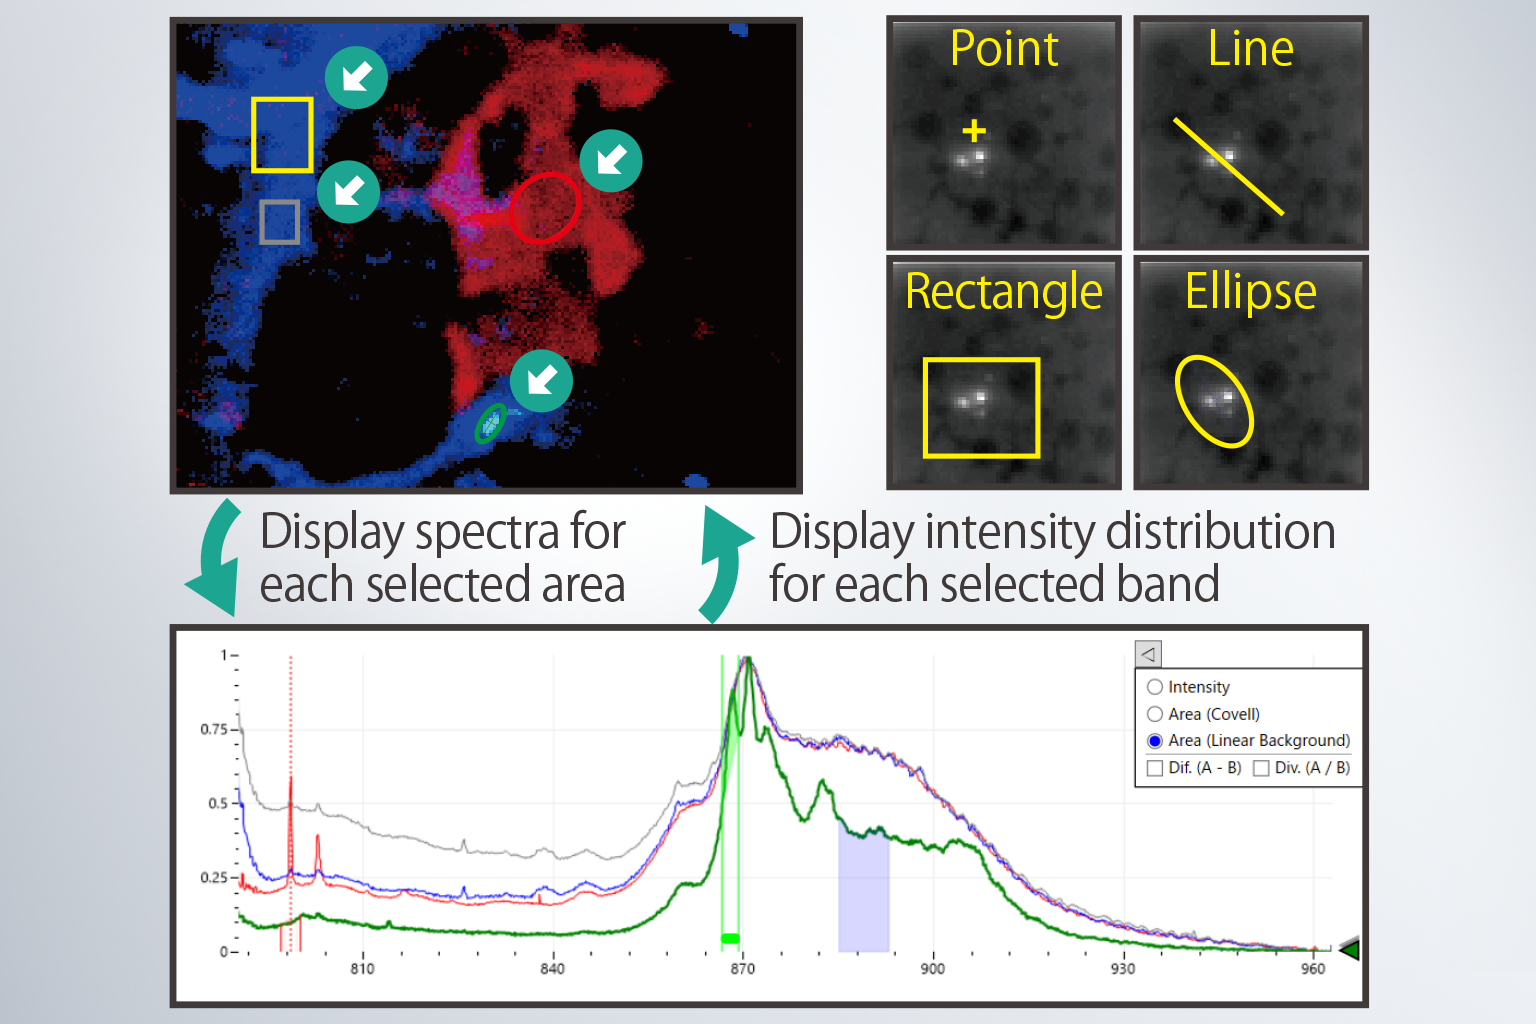
Various ROI selections and display modes
allow quick and intuitive data browsing.
Data captured by a hyperspectral camera
can be read in to perform calculations.

- Overview
- Specifications
- FAQ
Overview
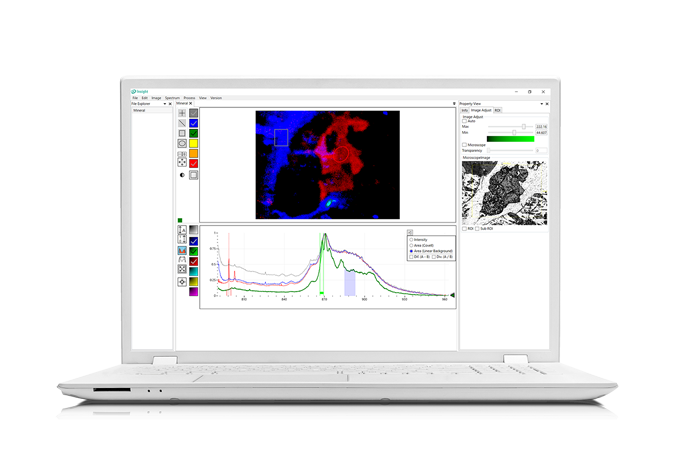
Insight is a software which handles hyperspectral images, two-dimensional images and spectra, measured by spectroscopy and microscopy instruments. Insight is also a powerful tool for various calculations on ENVI file format data captured by hyperspectral cameras.
For vibrational spectroscopy and microscopy
These data often have microscope pictures with their measurement location data as meta data which are shown together. Insight has a lot of functions to display, process and analyze them such as overlay display of translucent data over the microscope image.
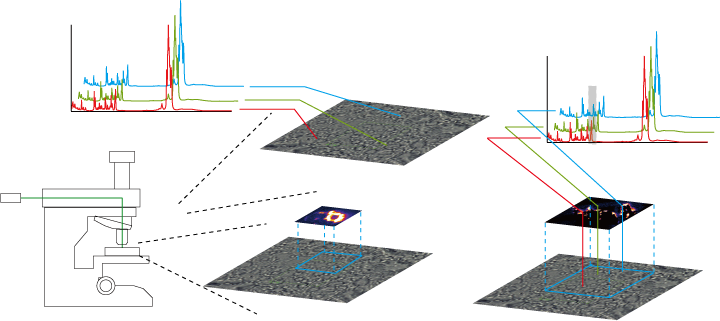
Fig. 1: Three kinds of data ( Spectra, a two-dimensional images and a hyperspectral image)
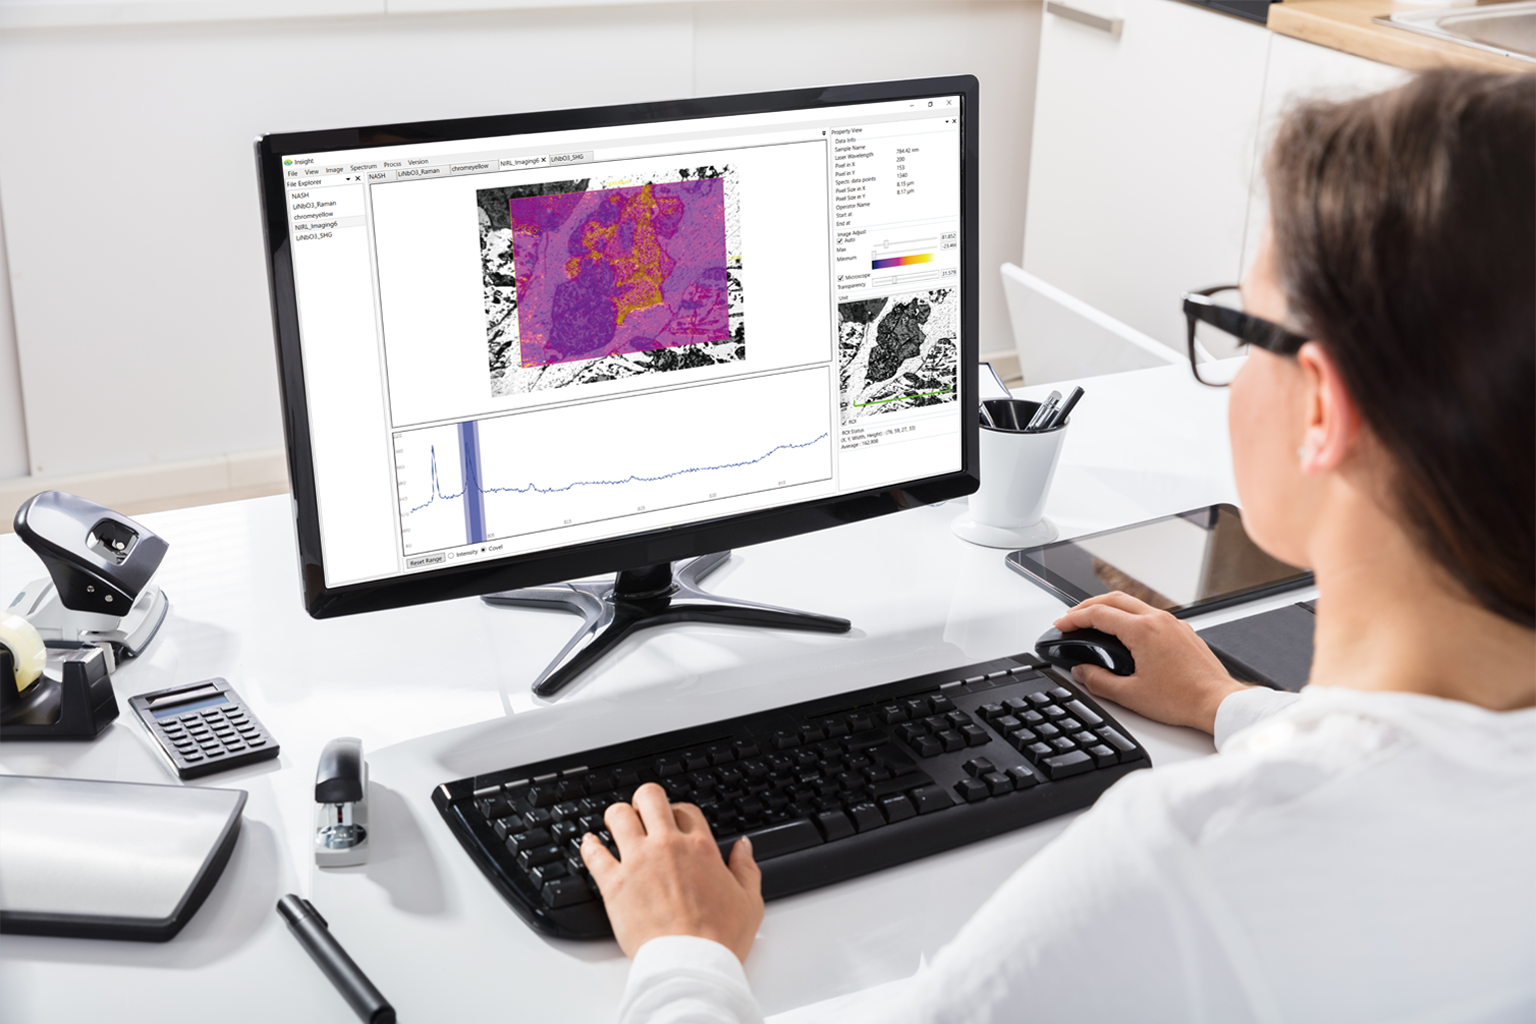
For data extraction and calculations of hyperspectral camera
Insight reads ENVI format data captured by a hyperspectral camera and allows you to freely browse wavelength data at each pixel. Since any region in the image can be selected and the averaged wavelength data can be exported, it is possible to extract only the wavelength data of a reference board that was captured at the same time as the observation target. It is also equipped with functions such as conversion to reflectance images and arithmetic operations for wavelength data of all pixels.
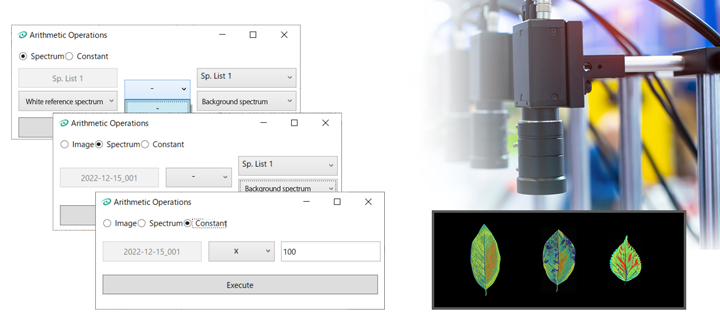
Fig. 2: Arithmetic operations for wavelength data captured by a hyperspectral camera.
Features
- Three kinds of data; hyperspectral images (.ssi), two-dimensional images (.smi) and spectra (.ssg)
- Flexible export/import between different format data.
- Integrated interface for all kinds of data format.
- Single window with tab-page system handles a variety of data easily.
- File explorer system makes it easy and quick to access any opened data.
- A lot of spectra are store in one data (.ssi)
- A lot of two- images are store in one data (.smi)
- Intuitive creation of spectrum image in a hyper-spectral image. (.ssi)
Functions
Spetrum [.ssg (scienceedge spectra graph) format]
- Plural spectra are handled in one data. Their visibility are controlled individually.
- Measurement location can be recognized on microscope images.
- Arithmetic operations between spectra. (+ − × ÷)
- Save as text data.
- Flexible and easy export/import between data
- Others
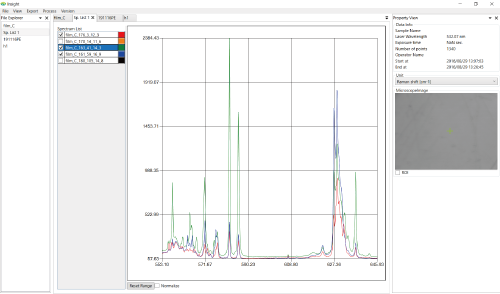
Fig. 3: Spectra Data
Two dimensional images [.smi (scienceedge multi-image) format]
- Export images
- Contrast Adjustment
- Translucent overlay images on a microscope image
- Others
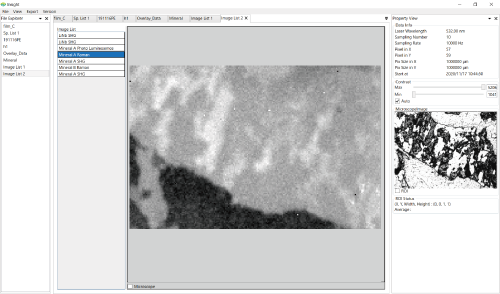
Fig. 4: Image Data
Hyperspectral images [.ssi (scienceedge spectrum-image) format]
- Spectral images creation with intuitive selection of spectra band.
- Spectral image creation mode: Intensity and peak area based on covell method.
- Arithmetic operations between all spectra in a hyperspectral image and an input spectrum (+ − × ÷)
- Export spectra to ssg data.
- Contrast adjustment of spectral image.
- Translucent overlay of a spectral image on a microscope image
- Others
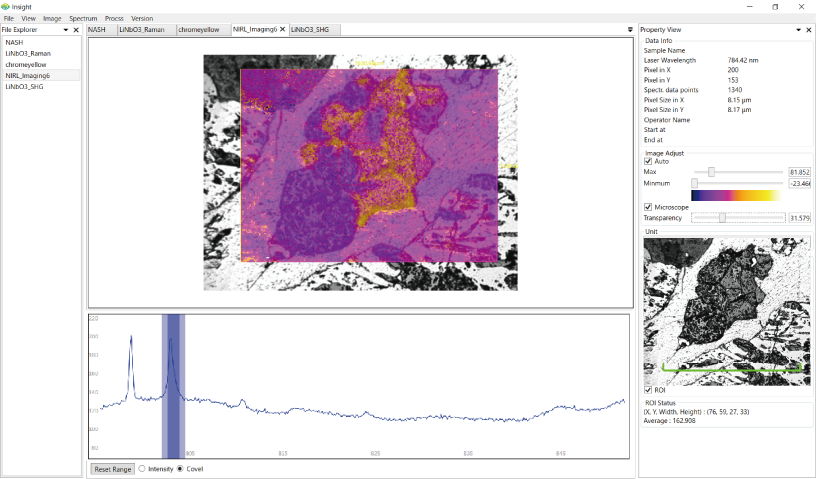
Fig. 5: Hyperspectral image data
Common
- Data handle with a file explorere
- Displaying a microscope image
- Displaying meta data such as measurement condition
- Save and open data
- Dispay version window
Applications
- Raman spectroscoy, Infrared Spectroscopy, reflection spectroscopy , absorption spectroscopy, and reflection spectroscopy
- Confocal microsocpe, Confocal fluorescence microscope, laser scanning micorscope and SHG microscope
- Raman miroscope, IR microscope, White-light spectroscopic microscope, LIBS microscope
Specifications
- Operating environment: Windows 10 64bit OS
- Version: V.1.4
- License: Permanent license with a USB dongle.
- Deliverable: An installation DVD, a USB dongle
Hystory
2020/12/14 : Ver 1.4.8 was released.
- Context menu for spectral range Setting in graph for SSI data is added.
2020/11/19 : Ver 1.4.7 was released.
- Psuedo color expression for SSI data/SMI data.
2020/10/01 : Ver 1.4.6 was released.
FAQ
Q1. Can spectra and hyperspectra data be handled wihtout a microsocpe picture as meta-data?
A1. Yes.
Q2. Is it possible to read ENVI format files?
A2. Yes, it is possible.
Q3. Is it possible to calculate an averaged spectrum for an arbitrarily selected range?
A3. Yes, it is possible. Various ROI (Region of Interest) selections such as line, rectangle and ellips are available.
Q4. Is it possible to convert a hyperspectral image to a reflectance image using a white and black reference spectrum?
A4. Yes. Hyperspectral image data can be converted to reflectance images using the four arithmetic operations function between hyperspectral image data or between hyperspectral image data and spectral data.
Q5. Can Insight convert full wavelength data to a text file?
A5. Yes, it can.
