Applications
Semiconductor & Nanotechnology
- Application note
- No. SEN001-IFCF-20230315-001
Thermal conductivity measurement of amorphous Ge1-xSnx thin films using frequency-domain thermoreflectance
- Keywords
- Semiconductor
- Nanotechnology
- Frequency-domain thermoreflectance
- InFocus κ FDTR
The thermal conductivities of amorphous Ge1-xSnx thin films with different Sn compositions were measured using frequency-domain thermoreflectance (FDTR). The results show that the thermal conductivity of the thin films decreases from 0.50 W/mK to 0.44 W/mK with increasing Sn composition, consistent with the amorphous limit calculated by the minimum thermal conductivity model.
Published Online: Mar. 24th, 2023
Download PDFIntroduction
The optimization of the thermal design of semiconductor devices is crucial for improving their performance and reliability. This requires a deep understanding of the thermal transport properties of the constituent materials, especially as semiconductor materials continue to become finer and thinner. Therefore, it is important to develop accurate and reliable methods for measuring the thermal properties of thin-film and nanoscale materials.
Laser flash analysis is a widely used technique for measuring thermal diffusivity of bulk materials. However, this method is not suitable for measuring the thermal properties of thin-film materials with fast temperature response. An alternative method, frequency-domain thermoreflectance (FDTR), is an optical pump-probe technique that can measure various thermal properties of thin films with thicknesses ranging from tens of nanometers to several micrometers.
In this application note, the thermal conductivities of amorphous Ge1-xSnx thin films with different Sn compositions were measured using ScienceEdgeʼs InFocus κ FDTR.
Sample preparation
Four a-Ge1-xSnx thin films with different Sn compositions were prepared by RF co-sputtering on a silicon substrate (resistivity: 1-20 Ωcm, thickness: 404 µm). All samples were coated with a 62 nm thick Au as a transducer and a 5 nm thick Cr layer was added between Au and thin film to improve adhesion. Sn composition and thickness of four a-Ge1-xSnx thin films are shown in Table 1.

Table 1. Sn composition and thickness of four a-Ge1-xSnx thin film samples. The thickness of the silicon substrate is 404 µm.
1
2
Experimental
The thermal conductivities of thin films were measured using ScienceEdgeʼs InFocus κ FDTR (frequency-domain thermoreflectance microscope).
An intensity-modulated 488 nm pump laser was used to create a periodic heat flux on the sample surface, and a 532 nm probe laser was used to monitor the surface temperature through a change of thermoreflectance signal. While changing the modulation frequency of the pump laser from 200 kHz to 10 MHz, the phase response of the reflected probe beam to the incident heat flux was recorded with a lock-in amplifier. It took 4 minutes to obtain a phase lag plot from 200 kHz to 10 MHz, and each sample was measured three times to ensure repeatability.
The thermal conductivity of thin films was determined by comparing the averaged phase lag of each sample and the calculated phase lag using a thermal transport model with unknown thermal conductivity as the fitting parameter. The multilayer sample model and nominal values for fitting are shown in Figure 1 and Table 2. Volumetric heat capacity of the thin films were calculated from literature values of Ge (1644.8 kJ/m3K) and Sn (1671.7 kJ/m3K) and their composition ratios.
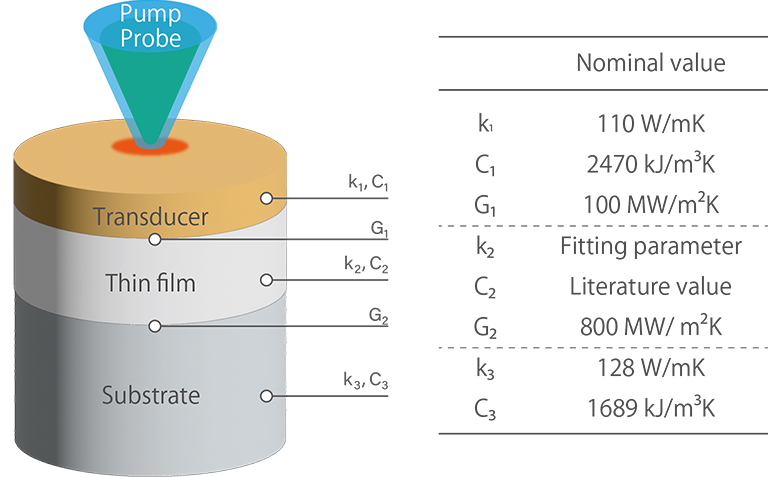
Figure 1. The multilayer sample model where each layer includes thermal conductivity k, volumetric heat capacity C, the thermal boundary conductance G, and layer thickness (not shown). Table 2. Nominal values for fitting analysis.
2
3
Results
As shown in Figure 2, the phase data for the four a-Ge1-xSnx thin films show clear differences with good reproducibility. Thereafter, fitting analysis was performed on the average phase data of three measurements for each sample.
Figure 3 (a) presents the averaged phase data (dots) and best-fit curve (solid line) obtained using a thermal conductivity value of 0.55 W/mK for the a-Ge thin film. This value is in close agreement with predictions from the minimum thermal conductivity model (0.62 W/mK)*1, as well as with values measured by Cahill et al. (0.51 W/mK)*2 and by Alvarez-Quintana et al. (0.64 W/mK)*3. Simulated curves obtained by varying the thermal conductivity by ±10% (0.50 to 0.61 W/mK) and ±20% (0.44 to 0.66 W/mK) are also shown. The variability of the three measurements is small compared to the ±10% range (Figure 3 (b)), and the uncertainty is approximately ±5%.
Table 3 summarizes the thermal conductivity results for the rest of the samples, which exhibit a decrease in thermal conductivity from 0.50 W/mK to 0.44 W/mK with increasing Sn composition. These values are close to the amorphous limit calculated by the minimum thermal conductivity model*4.

Figure 2. Phase vs frequency data obtained from FDTR measurements of the a-Ge1-xSnx thin films. Three different spots were measured for all samples.


Figure 3 (a). The averaged phase data of three a-Ge data (dots) and best-fit curve (solid line) are shown along with solutions obtained by varying thermal conductivity (k) by ±20% (dotted lines). (b). Variation in phase data of three measurements (dots) and solutions obtained by varying k by ±10% and ±20% (dotted lines).

Table 3. A summary of measured thermal conductivity.
Conclusions
We successfully measured the thermal conductivities of amorphous Ge1-xSnx thin films with different Sn compositions using ScienceEdgeʼs InFocus κ FDTR. The experimental setup and methodology demonstrated in this study provide an accurate and reliable method for measuring the thermal properties of thin-film and nanoscale materials. This highlights the excellent performance of ScienceEdgeʼs InFocus κ FDTR, and its potential for optimizing the thermal design of semiconductor devices.
Acknowledgements
We sincerely thank Dr. Kurosawa and Mr. Oiwa of Nagoya University for providing samples and for their helpful comments on the measurements and the draft of application note.
References
*1: Cahill et al., Phys. Rev. B 46, 6131 (1992).
*2: Cahill et al., Phys. Rev. B 37, 8773 (1988).
*3: Alvarez-Quintana et al., J. Appl. Phys 104(7) 074903 (2008).
*4: Khatami et al., Appl. Phys. Rev. 6, 014015 (2016).
