Introduction to Raman spectroscopy
What is Raman spectroscopy?
Raman spectroscopy is a vibrational spectroscopic technique that provides information on molecular vibrations and crystal structures. This non-destructive method uses a laser light source to irradiate a sample and generate Raman scattered light, which is detected as a Raman spectrum using a spectrometer and a CCD camera.
The characteristic fingerprint pattern in a Raman spectrum enables the identification of substances, including polymorphs, and the evaluation of local crystallinity, molecular orientation, and residual stress (tensile or compressive).
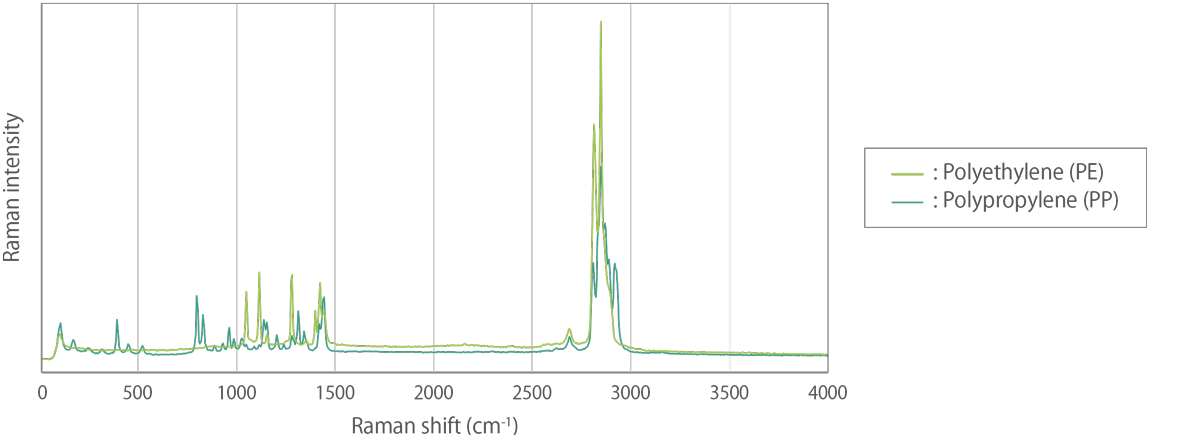
Figure 1. Raman spectra of polyethylene (PE) and polypropylene (PP).
Raman spectroscopy offers unique advantages, including:
- non-contact and non-destructive analysis,
- high spatial resolution up to sub-micron scale,
- in-depth analysis of transparent samples using a confocal optical system,
- no sample preparation requirements,
- the ability to measure both organic and inorganic substances samples in various states such as gas, liquid, solution, solid, crystal, and emulsion.
These advantages make Raman spectroscopy crucial in research and development (R&D) and quality assurance/quality control (QA/QC) in several industries and academic fields such as semiconductors, polymers, pharmaceuticals, batteries, life sciences, and more.
What is Raman scattering (Raman effect)?
When light interacts with matter, almost all of the scattering is an elastic process (Rayleigh scattering) with no energy change. However, a very small percentage of scattering is an inelastic process, leading to scattered light with different energy from the incident light (Figure 2.(a)). This inelastic scattering of light was predicted theoretically by Adolf Smekal in 1923 and first observed experimentally by Chandrasekhara Venkata Raman (Figure 2.(b)) in 1928, and it is called Raman scattering (Raman effect).
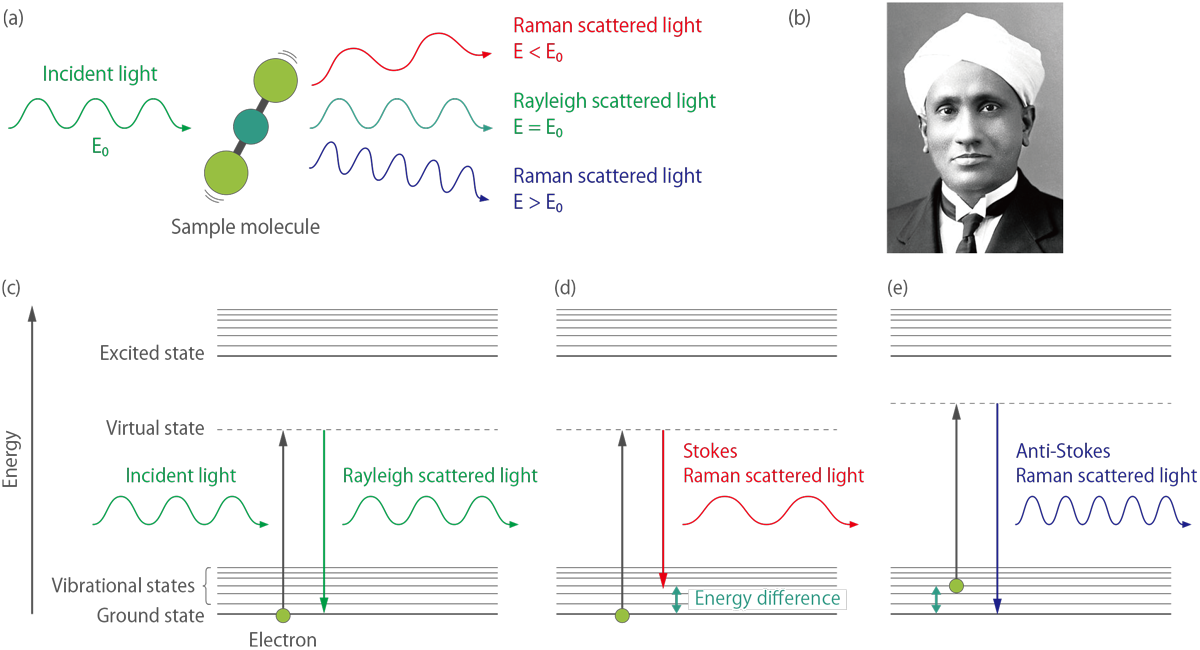
Figure 2.(a) Scattering of light by a molecule. (b) Sir Chandrasekhara Venkata Raman. (c)(d)(e) Diagram of the Rayleigh scattering and Raman scattering processes.
Figure 2.(c)(d)(e) depict the energy diagram of Rayleigh and Raman scattering processes. The incident light interacts with the molecule and distorts the cloud of electrons to form a “virtual state”. This state is unstable, and the photon is immediately re-radiated as scattered light. Rayleigh scattering is a process in which an electron in the ground state is excited and falls back to the original ground state, involving no energy change. Consequently, Rayleigh scattered light has the same energy as the incident light, meaning both lights have the same wavelength (Figure 2.(c)).
In contrast, Raman scattering can be classified as Stokes Raman scattering and anti-Stokes Raman scattering. Stokes Raman scattering is a process in which an electron is excited from the ground state and falls to a vibrational state, involving energy absorption by the molecule (Figure 2.(d)). Thus, Stokes Raman scattered light has less energy (longer wavelength) than incident light. On the other hand, anti-Stokes Raman scattering is a process in which an electron is excited from the vibrational state to the ground state, involving an energy transfer to the scattered photon (Figure 2.(e)). Consequently, anti-Stokes Raman scattered light has more energy (shorter wavelength) than incident light.
The Rayleigh scattering process is dominant, and Raman scattering is an extremely weak process, with only one in every 106 - 108 photons scattered. The ratio of Stokes Raman and anti-Stokes Raman scattering depends on the population of the various states of the molecule. At room temperature, the number of molecules in an excited vibrational state is smaller than that in the ground state. Therefore, generally, the intensity of Stokes Raman light is higher than that of anti-Stokes Raman light. As the temperature of the sample increases, the intensity of the anti-Stokes Raman light increases relative to the Stokes scattering light. Thus the local temperature of the sample can be measured from the intensity ratio of the two lights.
Raman thermometry is a contactless, steady state technique for measuring thermal conductivity based on probing of the local temperature using the Raman signal as a thermometer.
How to read Raman spectrum?
In a typical Raman spectroscopic analysis, Rayleigh scattering light is filtered out and only Stokes Raman scattering light is recorded. The Raman spectrum is expressed in a form of intensity of scattered light versus wavenumber (the reciprocal of wavelength, called Raman shift). For example, the Raman peak at 547.14 nm obtained by a 532 nm excitation wavelength can be converted into a wavenumber as below.

Light is often expressed in terms of wavelength, but in Raman spectroscopy, it is common to use wavenumbers that are linearly related to energy and to represent the Raman spectrum in a form that is independent of the excitation wavelength. For example, the Raman peak of crystalline silicon always appears at a wavenumber of 520.3 cm-1 at room temperature, no matter what excitation wavelength is used. However, if wavelength is used as the unit of abscissa, the Raman peak of silicon appears at 547.14 nm for 532 nm excitation and at 818.43 nm for 785 nm excitation.
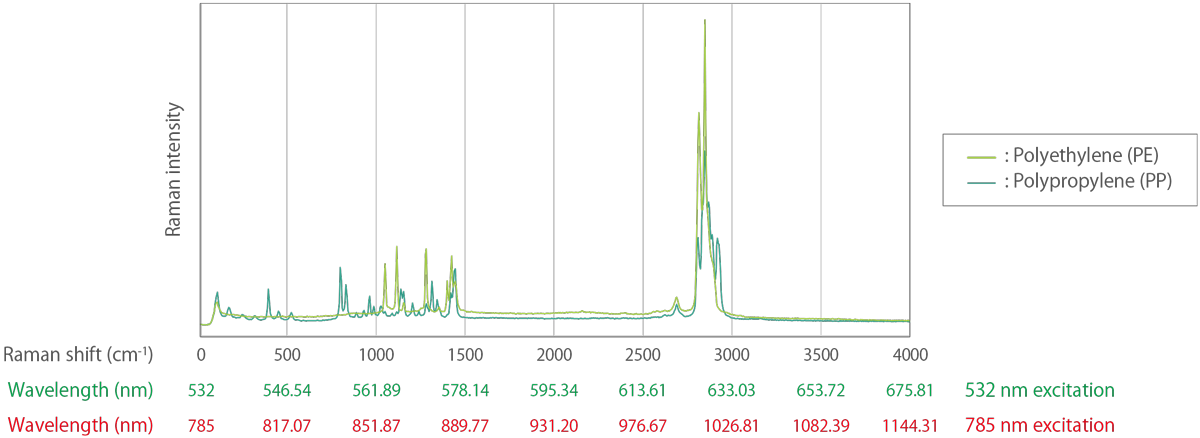
Figure 3. Example of Raman spectra with the horizontal axis converted to wavelengths at 532 nm excitation and 785 nm excitation.
When the Raman spectrum is obtained, it contains information on the vibrational modes of the sample. Each peak in the Raman spectrum corresponds to a particular vibrational mode of the molecule. The wavenumber of the Raman peak is related to the energy of the vibrational mode and the intensity of the peak is related to the magnitude of the change in polarizability associated with the vibration. The Raman spectrum provides a unique fingerprint of the sample, allowing for the identification of different substances and the characterization of molecular vibrations.
In addition to providing information on the vibrational modes of the sample, Raman spectroscopy can also be used to obtain structural information. The polarization dependence of Raman scattering can be used to determine the orientation of molecules in a sample. By changing the polarization of the excitation laser, it is possible to obtain information on the orientation of functional groups in the molecule.
Raman spectroscopy can also be used to study the crystallinity of a sample. The Raman spectrum of a crystal will exhibit sharp peaks due to the vibrational modes of the crystal lattice. By analyzing the peak widths and intensities, it is possible to obtain information on the crystallinity and orientation of the crystal.
In the Raman spectra of materials with internal stress or strain, it is known that the position of the Raman peak is shifted relative to the position of the material without stress. By evaluating this peak shift, it is possible to determine whether the stress is compressive or tensile and the magnitude of the stress.
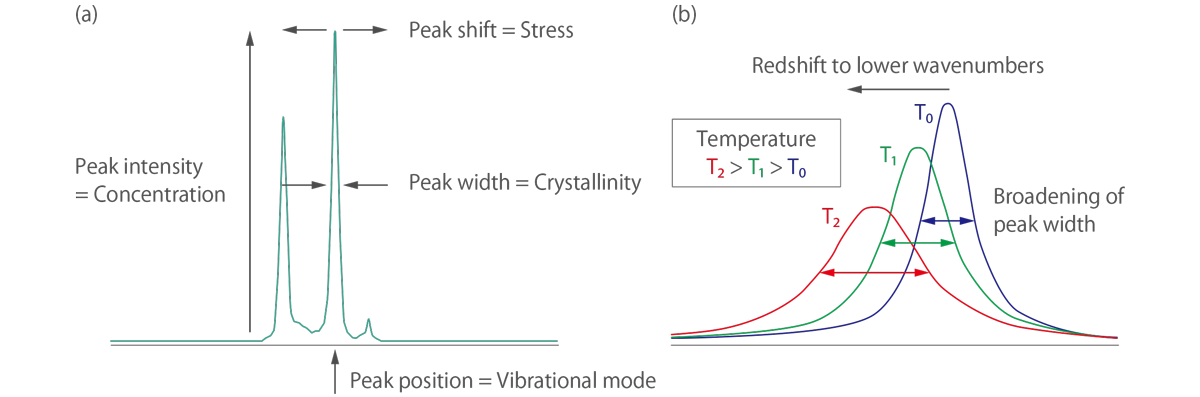
Figure 4. A simple guide to reading (a) Raman spectroscopy result and (b) Raman thermometry result.
In terms of Raman thermometry, the local temperature of the sample under the focused laser spot can be easily determined by fitting the spectral position and line width of the observed Raman mode. The temperature increase causes thermal expansion of a sample, resulting in a redshift of the Raman peak’s position and broadening of the linewidth of the Raman peak.
Conclusion
Raman spectroscopy is a vibrational spectroscopy technique that provides valuable information on molecular vibrations and crystal structures with submicron spatial resolution. It is a powerful analytical technique widely used for material identification and evaluation of molecular orientation, crystallinity, and residual stress. Raman spectroscopy can also measure local temperatures, making it useful for the study of thermophysical properties.
Apr. 2023
Index
- Introduction to time-domain thermoreflectance (TDTR)
- Basic principles of time-domain thermoreflectance (TDTR)
- Introduction to frequency-domain thermoreflectance (FDTR)
- Introduction to broadband frequency-domain thermoreflectance (BB-FDTR)
- Introduction to Raman spectroscopy
- About focus
